Create a dashboard
You can create multiple dashboards in a cube to display separate views and charts in a single page.
If the cube has multiple queries, you can add views relating to the different queries in a single dashboard.
To create a new dashboard :
-
Click Create dashboard icon
 on the Home Tab > New Ribbon or
 -
Right Hand Mouse Button on a View or chart name and Select New dashboard
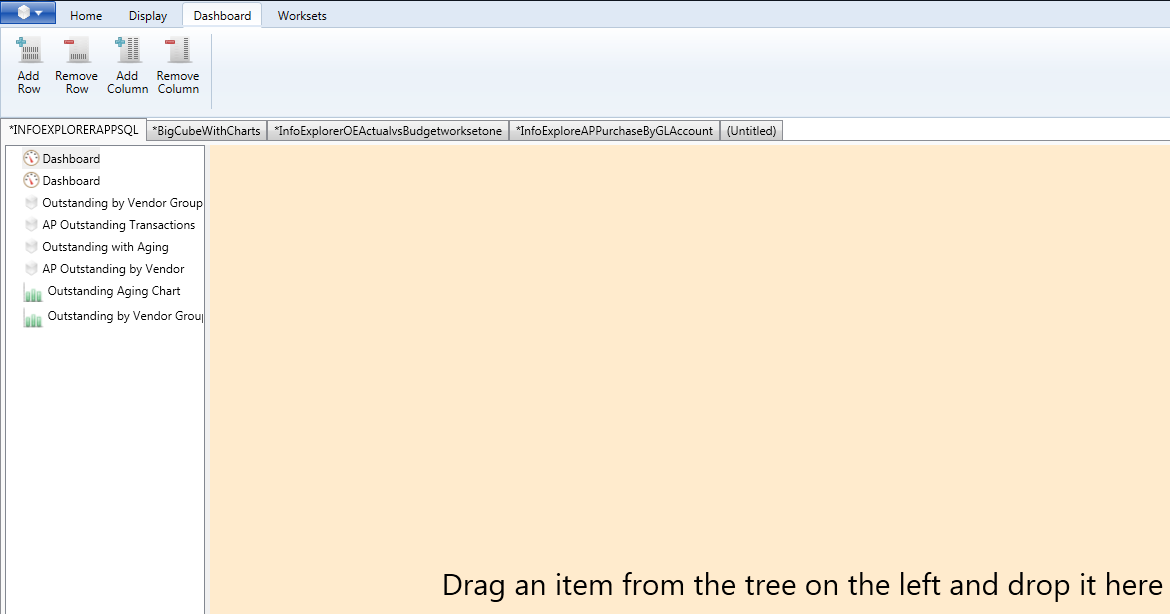
Amend size of views and charts
By default a New dashboard has 3 rows and 3 columns, allowing you to drag & drop 9 views or charts from the current cube to the dashboard.
Use “Create Row” , “Create Column”, “Remove Row” and “Remove Column” to adjust the dashboard size to have as many rows and columns as are required.
Add and remove views and charts to dashboard
-
Drag and drop the required views & charts from the available cube to the dashboard.
-
Select the Close icon on the top right on any individual dashboard view or chart to deselect this item.
For example, the following dashboard has 2 rows, and 1 column